Last Updated on February 25, 2024 by Mat Diekhake
Believe it or not, there are tools out there that are some of the most powerful to use for the Windows operating system, are made by Microsoft, and yet, are not already installed on your computers when you start using Windows. One of such tools is the Windows Debugger, or what you might know as the “WinDBG” tool for short.
The Windows Debugger is a tool that you can use to debug issues directly relating to the operating system itself, as well as any applications that you might have installed on the computer, too.
The Windows Debugger is a powerful tool because it allows you to put in breakpoints, execute and watch code as you’re making the changes. It’s also a free tool to download from Microsoft, so you don’t need to spend anything on it either.
You can get the Windows Debugger as part of the Windows 10 SDK package. When you go to download the SDK, you can pick and choose which parts of it you want to install, so there is no need to install it all on your computer if you’re looking to reserve space and time. Whats more, the latest version of the SDK also works for Windows 8 and Windows 7 operating system versions as well, so everyone just installs the same file.
How to Install WinDBG
1. Head to the Microsoft Developers webpage and download the Windows 10 SDK executable file (you’ll see the black button with the “exe” on it). Once you download it to your computer, open the file, using the method that you open files with your web browser, and then you’ll see what is the beginnings of the Windows Software Development Kit’s installation page, just like it is shown in the picture below. When you get there just leave it set on the “Install the Windows Software Development Kit,” unless you wanted to browse for a different location to save the file, and then click on the “Next” button at the bottom of the window.

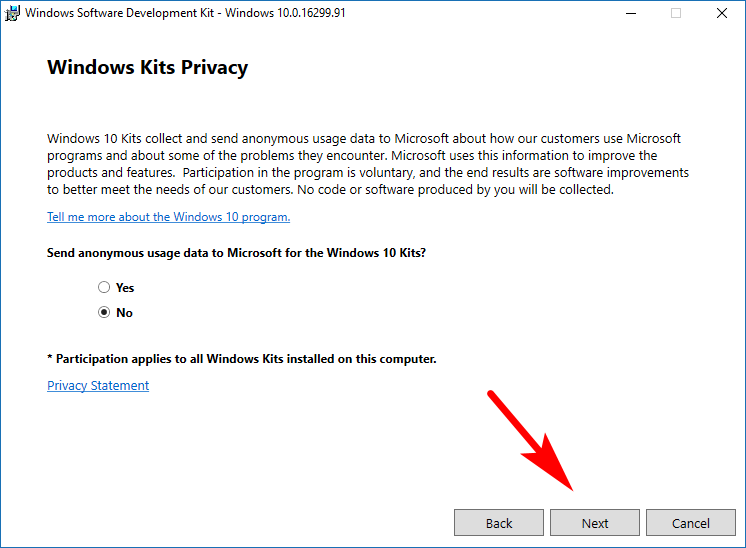
2. Windows would like you to submit data to them so they can gain knowledge about what happens on peoples computers when they’re using the kit. You can allow them if you like or decline by swapping the checkmark over to the “No” box. Click on the “Next” button when you’re ready to continue.
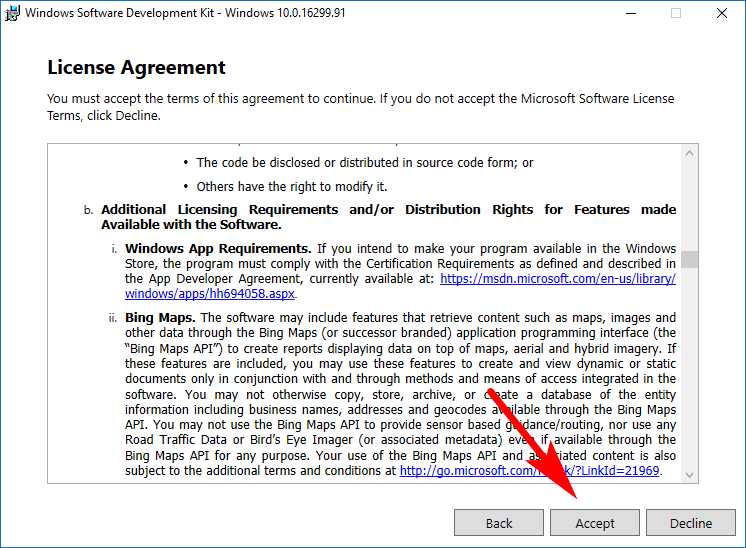
3. You then need to accept the Windows Software Development Kit’s license agreement before you can continue. Do that by clicking on the “Accept” button at the bottom of the page.
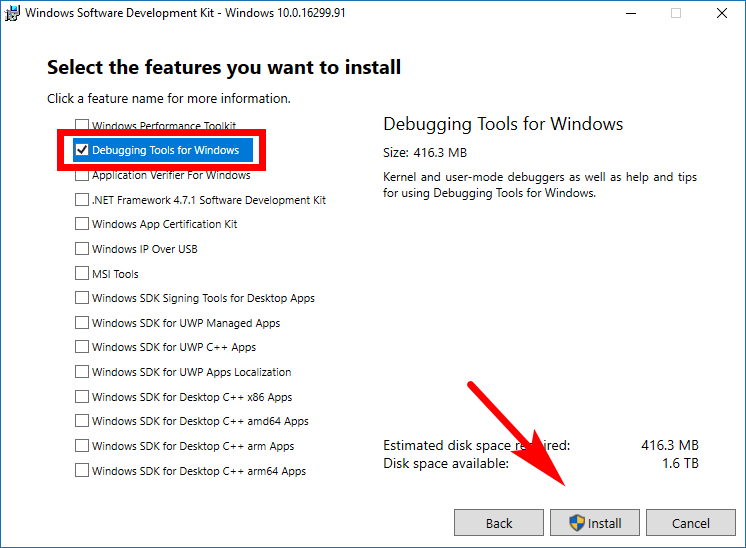
4. There’s quite a lot of stuff that goes into the Software Development Kit and you can keep it all if you want it.

5. But for the purpose of this guide, you only need to keep the “Debugging Tools for Windows” box checked and then click on the “Install” button at the bottom of the page when you’re ready to have it installed.
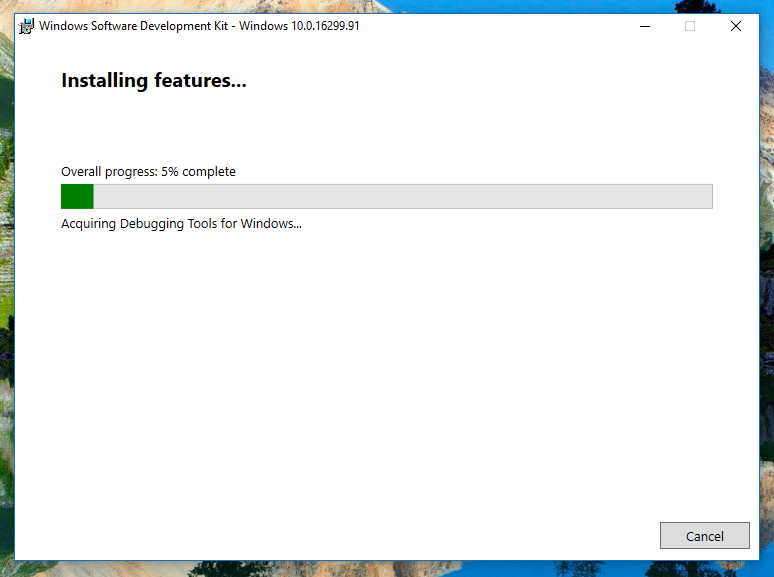
6. Wait for the installation to complete and then the new program is on your computer.
That gets the installation of the Windows Debugging tool out of the way. Now you need to learn how to configure it.
How to Configure WinDBG
1. As long as the program remains installed on the computer and it’s configured itself correctly, Windows will now write all appropriate information to a .dmp file whenever your computer encounters a Blue Screen of Death situation. Just because it’s created doesn’t mean you can read it yet though. To be able to read it, you need to open the elevated version of the Command Prompt and enter the following command: cd\Program Files (x86)\Windows Kits\10\Debuggers\x64\ to change the directory of the installation path.
2. You should now see the beginning of the next command in the Command Prompt window now starts with the C: programs files. In that line, enter the windbg.exe -IA command and then hit the Enter key on your keyboards. (If you don’t see the C: drive programs files path in the Command Prompt and instead you got a message that says the path could not be found, then the Windows Debugger has not been installed on the computer yet properly, so try that again.)
3. When those commands are completed, you should see a new window of WinDBG opening up on the computer’s display, with nothing on it but for a small confirmation box. You can close the WinDBG window after you see it.
4. Next up is configuring the WinDBG symbol path. This’ll be the path that WinDBG reads each time it reads a binary for the Blue Screen of Death .dmp file. It doesn’t matter what location you choose, but most people will recommend the default location because that’s the way most people do it and you might find it easier when seeking assistance if you run into any issues.
5. To create the symbol path you need, head to the Start menu, scroll down the list of All Apps until you get to the Windows Kits that you just installed, and then click on the WInDBG (X64) link.
6. It’ll now open the WinDBG window. From its menu, click on File >Symbol File Path and copy and paste the SRV*C:\SymCache*http://msdl.microsoft.com/download/symbols path into the available field under where it says “Symbol path.”
7. Now just save the new file path by navigating to the File > Save Workspace from the WinDBG menu.
You can now close the WinDBG. All that’s left to do now is test it out.
You might also be interested in:
- How to Delete a Wireless Network Profile in Windows 10
- How to Turn On/Off Notifications from Apps and Senders in Windows 10
- Classic Shell For Windows Is No Longer Being Developed
- How to Add/Remove a VPN Connection in Windows 10
You can subscribe to our RSS, follow us on Twitter or like our Facebook page to keep on consuming more tech.