Last Updated on February 2, 2020 by Mat Diekhake
Last fall at the Microsoft Edge Web Summit, we laid out our plans for rebooting the Microsoft Edge DevTools in response to your feedback. Today we’re announcing the availability of the DevTools as a web app from the Microsoft Store. The new Microsoft Edge DevTools Preview app allows you to preview the very latest DevTools running side by side with the tools included in Microsoft Edge.
You can install the DevTools Preview app on Windows 10 Fall Creators Update or newer. Because the DevTools Preview app is based on the most recent Insider Preview version of the Microsoft Edge DevTools, this allows you to use the most recent updates to the Microsoft Edge DevTools without installing a full Insider release.
In addition, some new features will be exclusive to the app – such as debugging outside of the local browser, including web content in apps and remote debugging devices.
Debugging the web outside of the browser
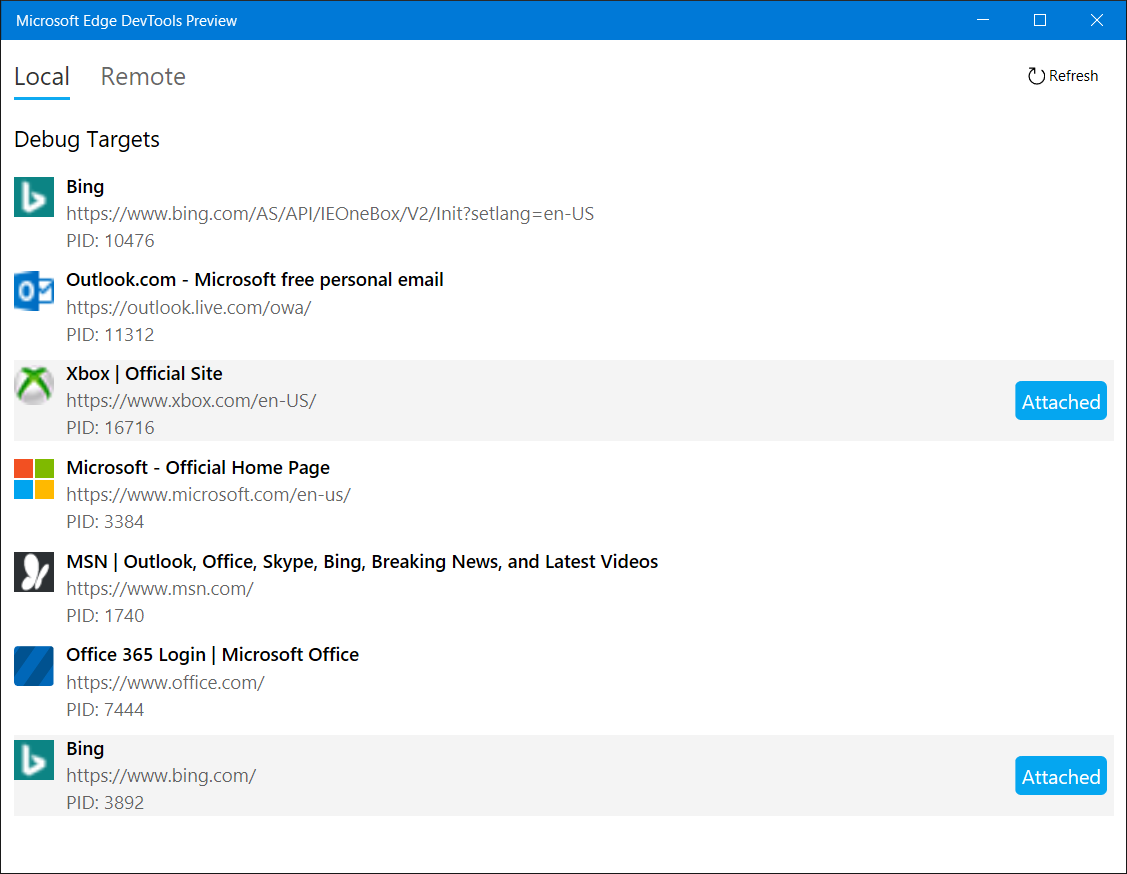
When we think of the web, we largely think of browsers. But the web shows up on many more surfaces than just the browser in Windows: WebViews in apps, add-ins for Office, Cortana, Progressive Web Apps in the Microsoft Store, and many more places. The DevTools preview app gives you the ability to attach the tools to any instance of the EdgeHTML engine on Windows to debug.
The DevTools Preview app allows you to attach the Microsoft Edge DevTools to any local or remote EdgeHTML target.Debugging remote devices
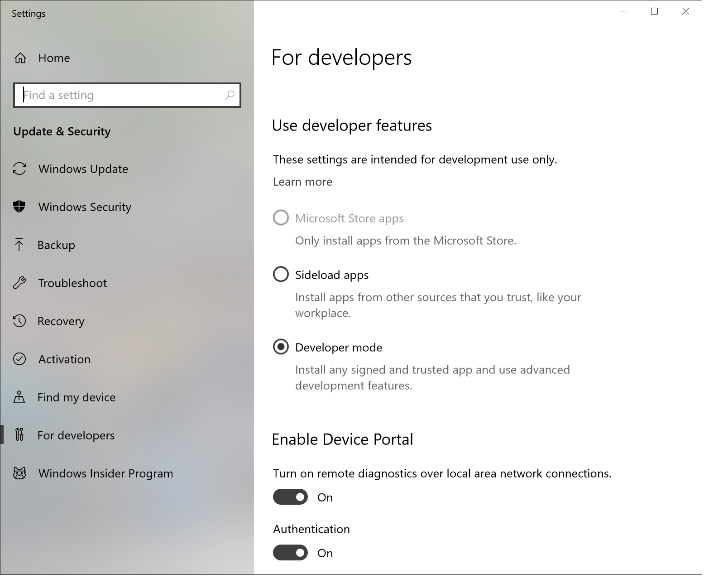
The web also runs on devices other than your dev machine. How do you debug the web on an Xbox, HoloLens, or an IoT device? One of the first features we’re previewing in the new DevTools app is remote debugging. By enabling Device Portal in the Settings app, you can now connect to that device over the network or via USB to debug remotely from the DevTools Preview app.
We’re previewing this with support for JS debugging of another instance of Microsoft Edge on another desktop device or VM. Over time, we’ll add support for the full set of DevTools against any EdgeHTML instance on any Windows 10 device. We’ll go into more detail on remote debugging in a future post.
Building a DevTools protocol for an ecosystem of tools
One of the biggest changes to the DevTools isn’t visible in a screenshot – the new Microsoft Edge DevTools Protocol. Previously, the Microsoft Edge DevTools worked via invasive native hooks into the EdgeHTML and Chakra engines. This made it hard for other tools like VS, VS Code, Sonarwhal, and other open source tools in the ecosystem to support Microsoft Edge.
We started a conversation with other browsers last fall to incubate DevTools protocols at the W3C, with the goal of promoting interoperability between engines and allowing tools to support cross-browser debugging more easily.
The new DevTools app uses EDP to remotely debug Microsoft Edge today, and, eventually, all of our DevTools will use EDP. We’ll share more about EDP and our roadmap for additional tools in a future blog post.
The future of the Microsoft Edge DevTools
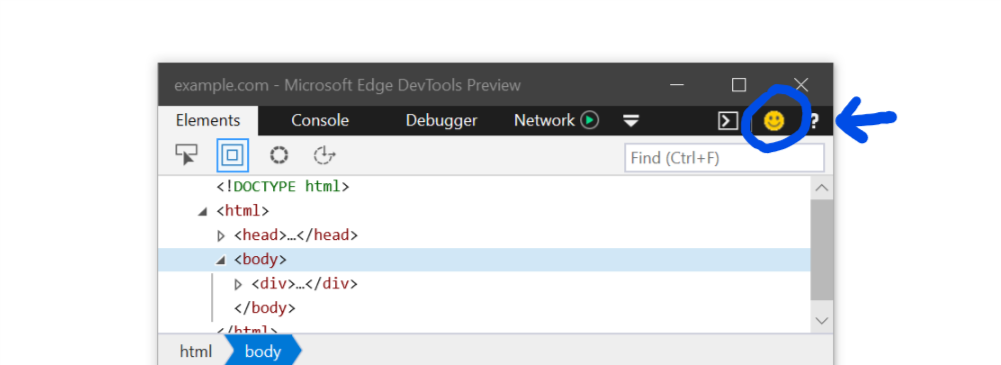
We’ve heard your feedback on the DevTools and we’re investing to make them great. Over the next several releases, we’ll evolve our tools based on your feedback. We encourage you to try out the DevTools Preview app, file feedback (just click the Smile icon in the DevTools), and reach out to us on Twitter with any comments!
We’ve got lots in store for the DevTools, including ongoing improvements in reliability and performance. With the Microsoft Edge DevTools Preview app, we can address your feedback faster and experiment with new ideas for the tools. We look forward to hearing what you think!
– Jacob Rossi, Principal PM Lead, Microsoft Edge DevTools
Source: Introducing the Microsoft Edge DevTools Preview app – Microsoft Edge Dev Blog