Last Updated on February 25, 2024 by Mat Diekhake
When using the Windows operating system, you might encounter the Blue Screen of Death (BSOD) which stops you from being able to use the computer and will require a restart. The BSOD happens when the computer suffers from software issues, drive issues or faulty hardware. In most cases, the BSOD will be present from hardware drive software issues. It isn’t possible for application software to cause a blue screen error—that’s sometimes called a stop error, too—in the Windows operating system because, during those times, the application just crashes instead.
The BSOD has been around for many years and versions of Windows. Since Windows 8 things have become much simpler and it’s a lot easier to get the information you need for troubleshooting.
Most BSOD’s are fixed by just following what the instructions on the computer’s display tell you to do, such as restarting the computer. But if you have a reoccurring problem then it might take some troubleshooting to investigate the issue further. Windows 10 creates Dump Files that can be used by the administrators to help debug the problems. Windows 10 creates those Dump Files automatically with its default settings, so there is nothing you need to do to get them working.
There are five different types of memory dumps that Windows 10 uses. They are the following: small memory dumps, kernel memory dumps, complete memory dumps, automatic memory dumps, and active memory dumps. Here is more information on each of them:
- Small Memory Dumps. A small memory dump, also known as a mini memory dump, can be found by navigating to the C:\Windows\Minidump of the operating system. It contains the information regarding the current processes of the thread that created the crash, stop code, list of device drivers that are loaded, parameters, and the kernel stack for the thread that created the crash.
- Kernel Memory Dumps. A kernel memory dump contains the kernel-mode read/write pages available from physical memory when the crash occurred. It doesn’t contain anything else. The kernel-mode only dump does not contain any information regarding the user-mode processes. Like the complete memory dumps, if a second crash occurs, the previous bits of information with regards to the kernel memory dumps are overwritten, and only the most recent dump is shown.
- Complete Memory Dumps. A complete memory dump focuses on collecting all of the contents coming from the RAM (physical memory) when the crash occurs. That may also include information about what processes were running at the time of the crash so that you can evaluate them. The first lot of information captured by the complete memory dump is overridden when there is a second crash, so you only get the information regarding the most recent system crash all the time.
- Automatic Memory Dumps. The automatic memory dump gives the same information that’s found in a kernel memory dump. The automatic memory dump will have a paging file set large enough by Windows so that the kernel memory dump has enough space to be captured. That happens because Windows sets the size to be “System managed size” when the kernel-mode crash dump is set to on the automatic memory dump.
- Active Memory Dumps. An active memory dump is just focusing on the active memory of the kernel and the user mode. It allows for the chance to grab the kernel information and user information without having to use the complete memory dump. A complete memory dump is a lot larger than just the active memory dump, which is why that’s useful.
The following tutorial demonstrates how to configure the Windows 10 operating system to create dump files of the Blue Screen of Death problems you may be having.
How to Configure Windows 10 to Create Dump Files on Blue Screen of Death (BSOD)
You can create Dump Files on the BSOD by using the Start-up and Recovery found in the Control Panel. Here is how you can do that:
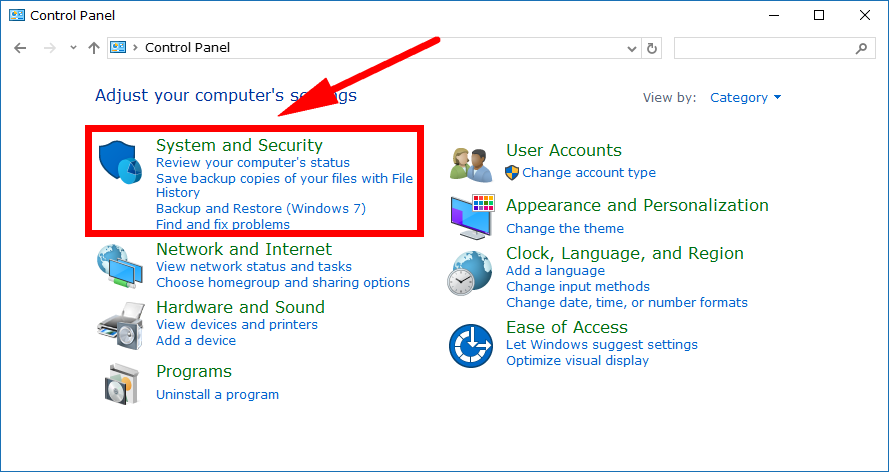
1. Navigate to the Control Panel by typing Control Panel into the search field in the taskbar and then clicking on the Control Panel desktop application available under the Best match section of the popup window.
2. Next, choose to be showing the Category from the drop-down menu next to View by in the top right side of the Control Panel window and then click on the System and Security link.
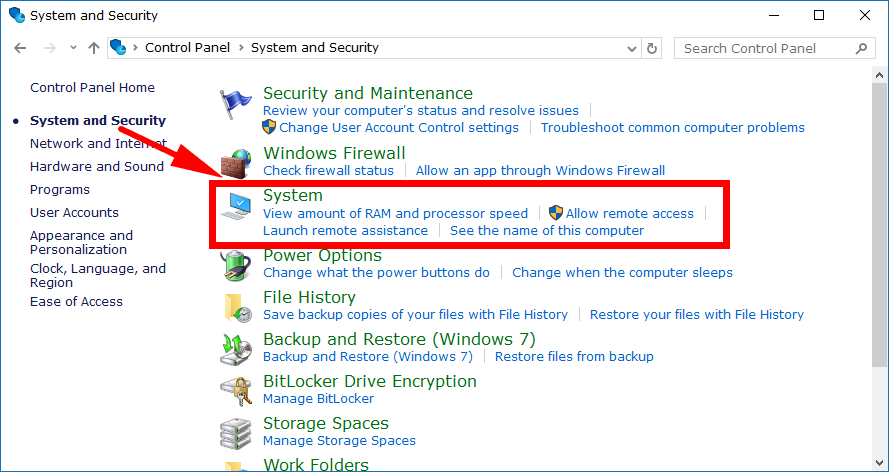
3. Now click on the System link from the right side of the System and Security area.
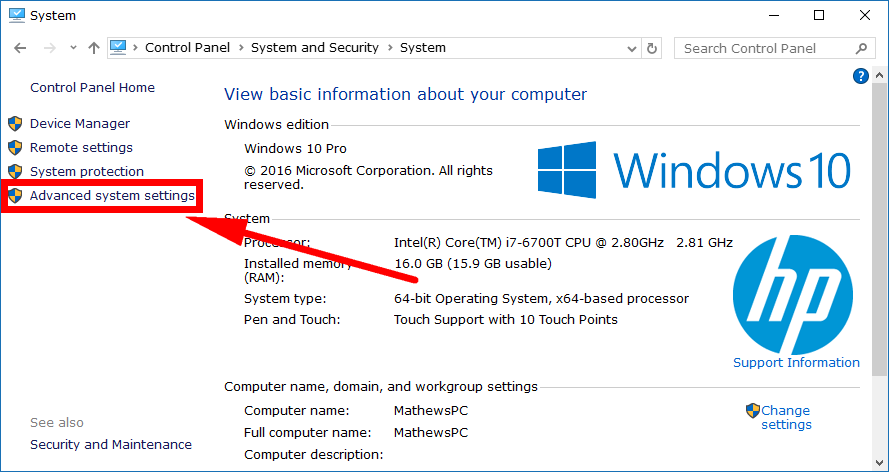
4. Click on the Advanced system settings from the left side pane when you’re within the System area.
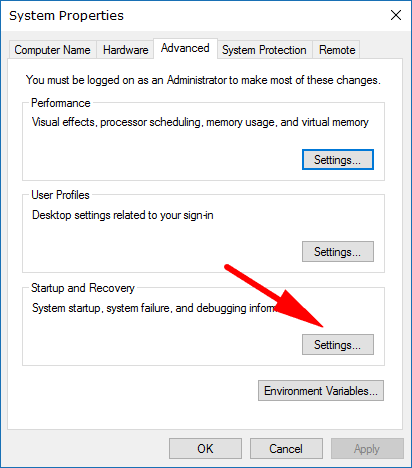
5. You should now have the System Properties dialog box open. By default, it opens up to be showing the Advanced tab. Leave it there and click on the Settings button under the Startup and Recovery section.
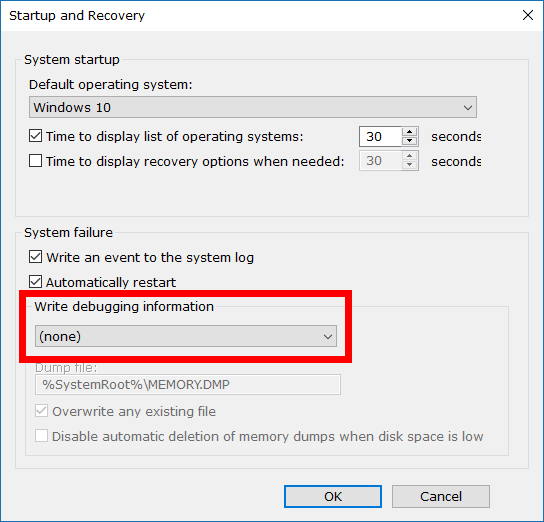
6. You’ll now have the Startup and Recovery dialog box open. Under the System failure heading is a drop-down menu with the heading Write debugging information that you need to click on next to choose what kind of dump file you want to create. If you want there to be no dump file, then select None from the menu and then click on the OK button, which will save your preference and close the dialog.
7. Select the Small memory dump if you want Windows to create the small memory dump. Click on the OK button at the bottom of the Startup and Recovery dialog box to apply the changes and close the dialog.
8. Select the Kernel memory dump if you want Windows to create a kernel memory dump. Click on the OK button at the bottom of the Startup and Recovery dialog box to apply the changes and close the dialog.
9. Select the Complete memory dump if you want Windows to create a complete memory dump. Click on the OK button at the bottom of the Startup and Recovery dialog box to apply the changes and close the dialog.
10. Select the Automatic memory dump if you want Windows to create an automatic memory dump. Click on the OK button at the bottom of the Startup and Recovery dialog box to apply the changes and close the dialog.
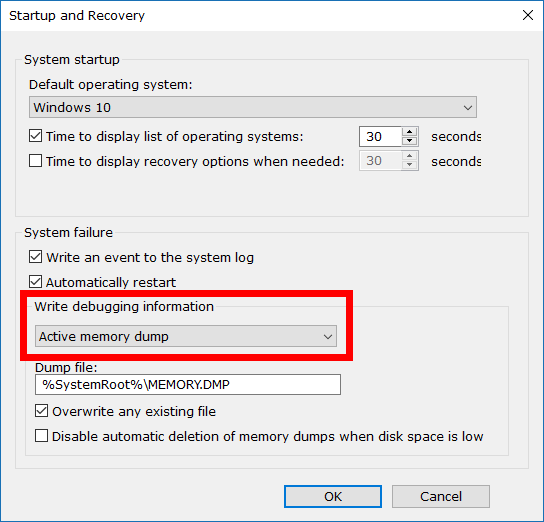
11. Select the Active memory dump if you want Windows to create an active memory dump. Click on the OK button at the bottom of the Startup and Recovery dialog box to apply the changes and close the dialog.
Windows 10 has the Dump Files set to automatic so your BSOD analyst can always get what they need, but if you wanted to change that to one of the other options, you could do it from within the Start and Recovery dialog box using one of the options listed above.
That’s all.
This article was last updated on May 31, 2019.
Related Tutorials



September 14, 2018 @ 15:20
Over the last six months or so I continue to get a Blue Screen Of Death that says BAD_POOL_CALLER. It reboots my computer and everything seems fine until it happens again.
I have not been able to work out why this keeps happening. There doesn’t seem to be any common thing I do on the PC that makes this error happen. I can be browsing many different sites at the time. I can have many tabs open or hardly any. Sometimes I’m not even using a browser window.
I contacted Microsoft support about this but they didn’t do anything to solve it.
September 14, 2018 @ 15:30
Sharing the results of your dump files could help. But this is a fairly common issue.
It happens when a Windows application wants to use a processor thread that doesn’t exist or is unavailable. It may also occur is the same processor thread is being used by another program, although that seems the unlikely scenario because it’s happening over and over again. It’s basically a bad pool request by a thread in the processor.
You can use the Driver Verifier (Cortana search > type “Driver Verifier”) to check for unsigned drivers that may be causing it.
You can also update the device drivers. Having drivers that aren’t up to date can cause this.
You can also run the Windows Memory Diagnostics tool and see if Windows can find the problem for you.
September 14, 2018 @ 15:04
I received a BSoD the other day that was actually a Green Screen of Death. Has anyone seen this before?
Maybe I am being trialed for a new green screen instead of the old blue screen because of some kind of color psychology.
September 14, 2018 @ 15:09
I’ve seen the Green Screen of Death as well.
Something along the lines of: “Your PC ran into a problem and needs to restart. We’re just collecting some error info, and then you can restart.”
I tend to get this when I’m using Windows Insider builds, so I think it is probably related to Windows 10 test builds.
I agree that this is likely a trial to see how people react to it being a green screen instead of blue. But Microsoft might also have their reasons for wanting to differentiate between test builds and the real thing. Perhaps to remind people that they’re using a test build and that’s why it is breaking down more often than usual.