Microsoft has updated Visual Studio Code to version 1.53 and it comes with a bevy of features including Wrap tabs, tab decorations, emmet performance and feature improvements and more.
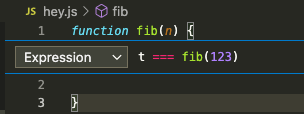
The breakpoint editor zone widget now supports syntax coloring by respecting the language mode of the underlying editor.
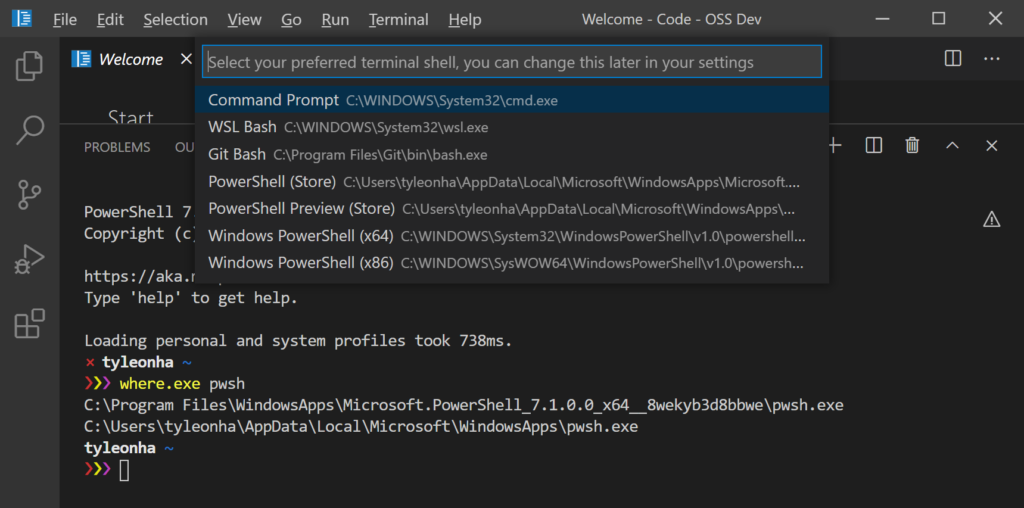
If you install PowerShell 7 on Windows, VS Code will use that as the default shell. If you don’t have PowerShell 7 installed, VS Code will continue to use Windows PowerShell as the default. Additionally, if you open the Select Default Shell Quick Pick, the enumeration of all of the installed PowerShell versions will show up (MSI installation, Microsoft Store installation, etc.).
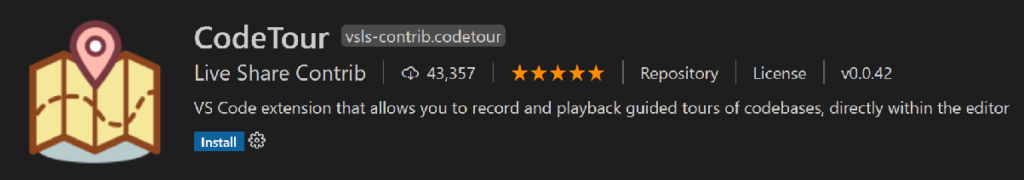
A new CodeTour topic introduces educators to the CodeTour extension that lets them easily author walkthroughs for codebases. Educators can create self-paced tours for their students as they ramp up on new projects and assignments.
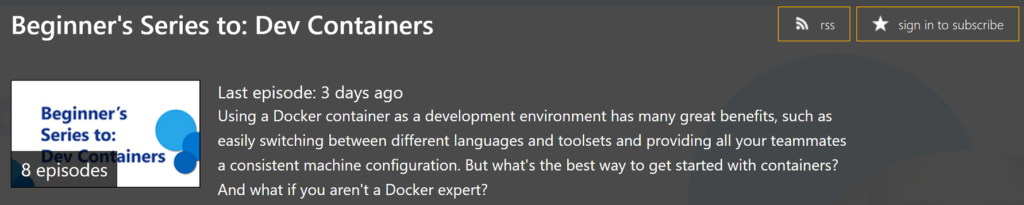
Check out our new Beginner’s Series to: Dev Containers, a set of eight videos that show you how to get, create, and configure a container-based development environment using VS Code Remote – Containers.
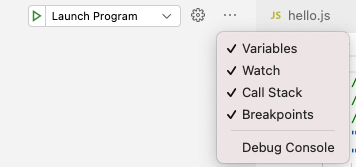
In order to make more room for the debug dropdown menu in the debug view, we have moved the Debug Console action to the secondary menu (…). In addition, we believe that the need for the action is small given that the debug console opens automatically when a debug session starts.
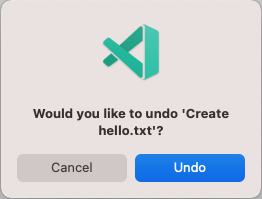
If a user tries to quit VS Code while there is a file operation in progress, we now show a confirmation dialog. We also show a confirmation dialog for destructive undo operations from the Explorer. We always want to avoid data loss, so we’ve introduced these dialogs to make sure it doesn’t happen by accident.
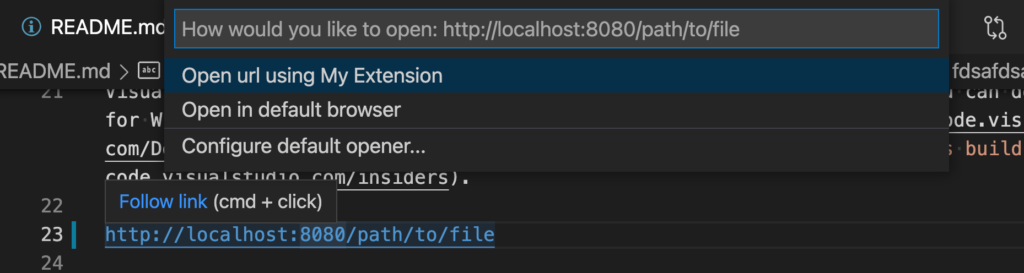
Now when you select links to localhost:8080 in the editor or terminal, you will be prompted to select how the URL should be opened:
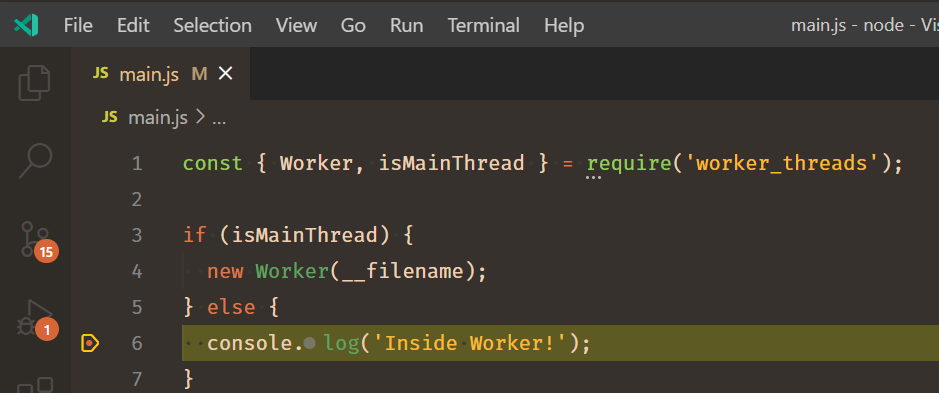
Debugging of Node.js worker_threads is now supported.
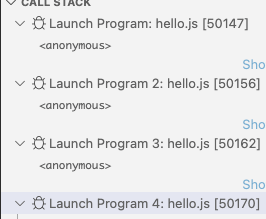
We have removed the restriction that only a single debug session can be started from a launch configuration. You can now start multiple concurrent sessions by pressing the green run button in the debug configuration dropdown menu any number of times. Each subsequent debug session will have a number appended at the end of the name so they can be easily distinguished.
We’ve updated our New File and New Folder icons to make them consistent with the rest of our iconography library:
![]()
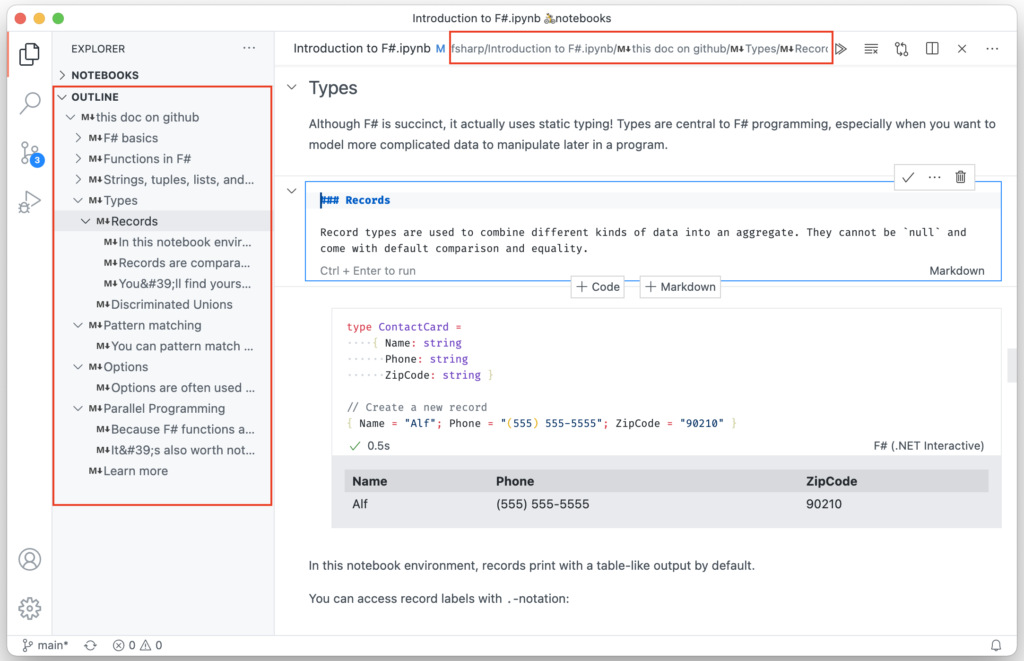
Notebook cells now show up in the outline pane and breadcrumbs. This allows for a better overview and fast navigation within notebooks.
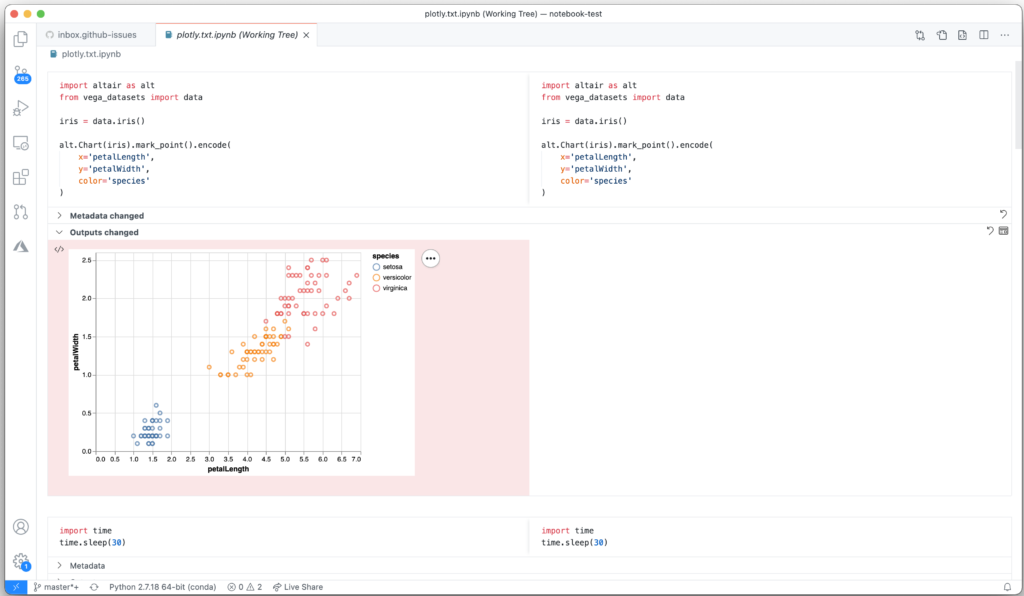
The diff editor for notebook documents now supports rendering rich output like tables, images, or HTML output.
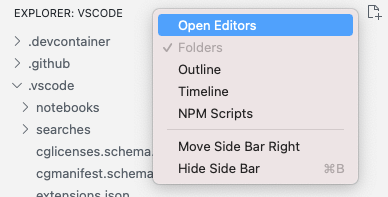
The Open Editors view is now hidden by default. This will only affect new VS Code users, and existing users will still see the Open Editors view. We wanted to present a cleaner look in the Explorer view out-of-the-box, and we believe that the functionality provided in the Open Editors view is covered in other areas of the workbench, like tabs. The visibility of the Open Editors view can be controlled by the context menu in the Explorer view title area.
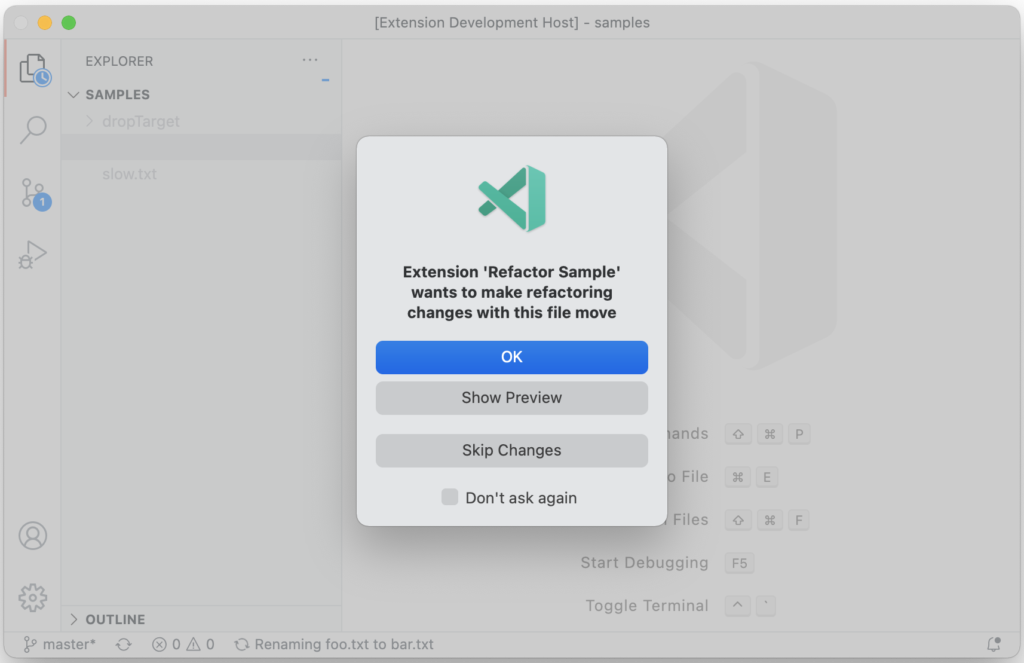
Extensions can participate when you create, move, rename, or delete files. This is useful when automatically running refactorings, for example, when you rename a Java file and also need to rename its public class.
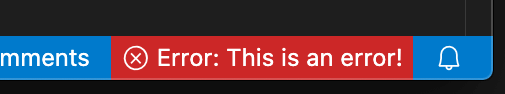
The previously proposed backgroundColor for the StatusBarItem API is now stable. Currently only statusBarItem.errorBackground is supported to avoid the Status bar looking too colorful. We may expand this support to more colors in the future
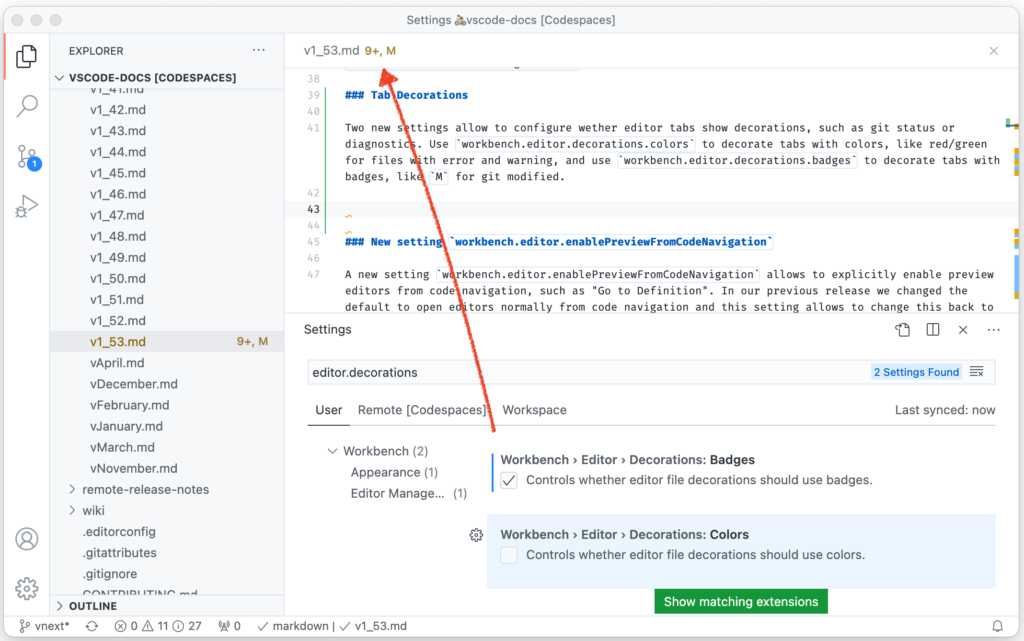
Two new settings allow you to configure whether editor tabs show decorations, such as git status or diagnostics. Use workbench.editor.decorations.colors to decorate tabs with colors, like red/green for files with errors and warnings, and use workbench.editor.decorations.badges to decorate tabs with badges, like M for git modified.
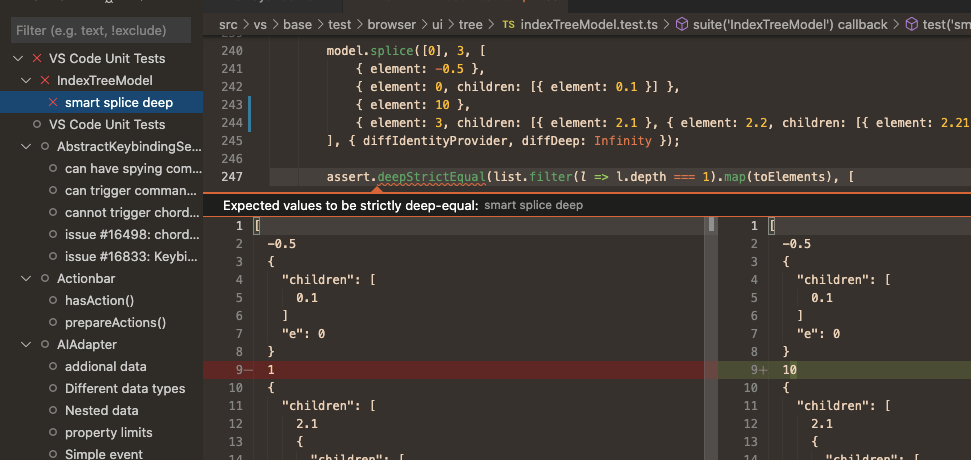
We are investigating testing in VS Code, and the first version of the API is now present in vscode.proposed.d.ts. Please read the linked issue for more context, and participate if you have input. This iteration focused building out the Selfhost Test Provider for VS Code and foundational UI, primarily the test explorer, gutter decorations, and peek views for results. For example, here’s a failed test showing the difference between actual and expected values in a diff peek view:
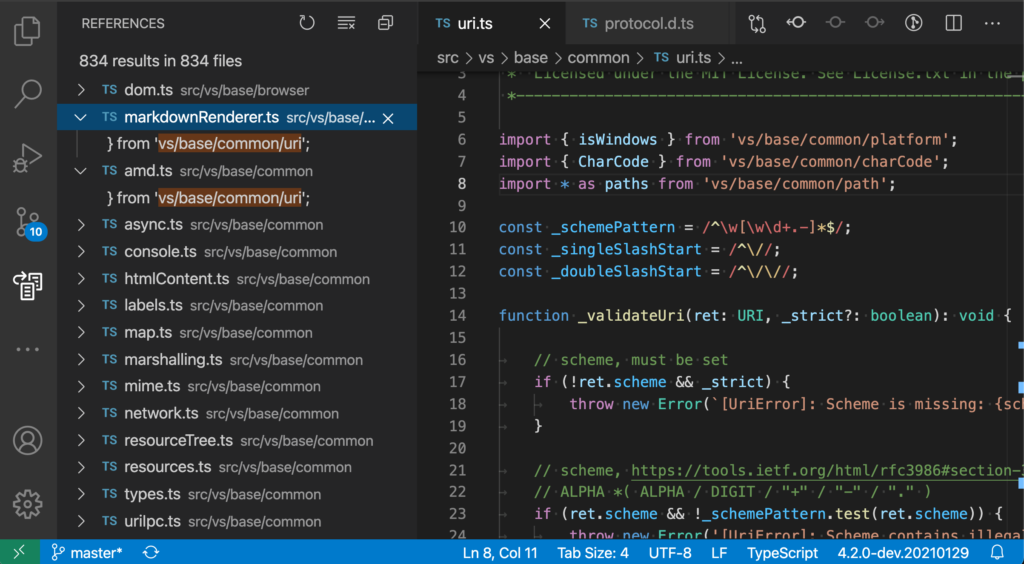
If you are using TypeScript 4.2, you can also try the new Find References to File command for JavaScript and TypeScript to find all places where a file is being referenced.
You can download Visual Studio from its own website: Download Visual Studio Code.
Related Articles
- Windows 10 KB4601319 Updates Verifying Usernames, Passwords
- Microsoft PowerToys Gets Launcher and New Welcome Screen
- Regular and Extensive Modes Come to Windows File Recovery
- Microsoft Adds Autofill to Authenticator App and Chrome as an Extension
- Windows 10 Build 21313 Alters Default Blue Accent Color
- Redesigned Action Center with New Background from Sun Valley Project Now on Insider Builds
- Illustrations and Icons Added to Microsoft Visio Library in Latest Office Insider Build